Grundläggande statistik
| Institutionella ägare | 161 total, 147 long only, 0 short only, 14 long/short - change of 94,12% MRQ |
| Genomsnittlig portföljallokering | 0.0044 % - change of −44,34% MRQ |
| Institutionella aktier (lång) | 68 091 667 (ex 13D/G) - change of 4,04MM shares 455,94% MRQ |
| Institutionellt värde (lång) | $ 640 521 USD ($1000) |
Institutionellt ägande och aktieägare
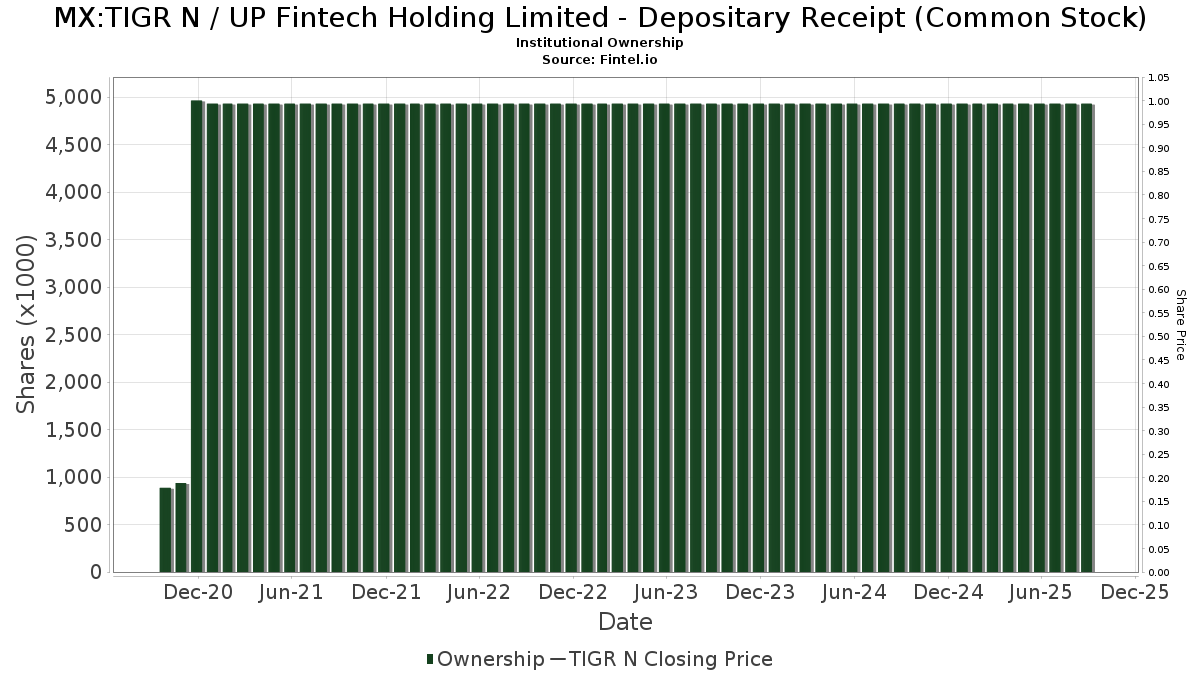
UP Fintech Holding Limited - Depositary Receipt (Common Stock) (MX:TIGR N) har 161 Institutionella ägare och aktieägare som har lämnat in 13D/G- eller 13F-formulär till Securities Exchange Commission (SEC). Dessa institut innehar totalt 68,091,667 aktier. Största aktieägare inkluderar Avenir Tech Ltd, Sparta 24 Ltd., Capital International Investors, Arrowstreet Capital, Limited Partnership, Group One Trading, L.p., Jupiter Asset Management Ltd, Susquehanna International Group, Llp, Susquehanna International Group, Llp, Jane Street Group, Llc, and BlackRock, Inc. .
UP Fintech Holding Limited - Depositary Receipt (Common Stock) (BMV:TIGR N) Institutionell ägarstruktur visar institutioners och fonders nuvarande positioner i företaget, samt de senaste förändringarna i positionernas storlek. Större aktieägare kan vara enskilda investerare, fonder, hedgefonder eller institutioner. Bilaga 13D visar att investeraren äger (eller ägde) mer än 5% av företaget och avser (eller avsåg) att aktivt eftersträva en förändring av affärsstrategin. Schedule 13G indikerar en passiv investering på över 5%.
Fondsentimentets poäng
Fondsentimentet poängen(fka Ägarackumulation-poäng) visar vilka aktier som är mest köpta av fonder. Det är resultatet av en sofistikerad kvantitativ flerfaktormodell som identifierar företag med de högsta nivåerna av institutionell ackumulering. Poängsättningsmodellen använder en kombination av den totala ökningen av redovisade ägare, förändringarna i portföljallokeringarna för dessa ägare och andra mått. Siffran sträcker sig från 0 till 100, där högre siffror indikerar en högre nivå av ackumulering i förhållande till sina konkurrenter, och 50 är genomsnittet.
Uppdateringsfrekvens: Dagligen
Se Ownership Explorer, som innehåller en lista över de högst rankade företagen.
AI+ Ask Fintel’s AI assistant about UP Fintech Holding Limited - Depositary Receipt (Common Stock).
Select a question to share a public post with an AI-crafted answer.
Thinking of good questions…
13F- och NPORT-arkiveringar
Detaljer om 13F-arkiveringar är gratis. Detaljer om NP-arkiveringar kräver ett premiummedlemskap. Gröna rader indikerar nya positioner. Röda rader indikerar stängda positioner. Klicka på länk symbolen för att se hela transaktionshistoriken.
Uppgradera
för att låsa upp premiumdata och exportera till Excel ![]() .
.
| Fil Datum | Källa | Investerare | Typ | Genomsnittligt pris (beräknat) |
Aktier | Δ Aktier (%) |
Rapporterat värde (1000 USD) |
Δ Värde (%) |
Portföljallokering (%) |
|
|---|---|---|---|---|---|---|---|---|---|---|
| 2026-02-17 | 13F | Wellington Management Group Llp | 24 400 | −69,94 | 233 | −73,09 | ||||
| 2026-02-17 | 13F | Susquehanna International Group, Llp | Put | 851 200 | −89,36 | 8 137 | −90,46 | |||
| 2026-02-13 | 13F | Verition Fund Management LLC | 69 768 | −31,45 | 667 | −38,62 | ||||
| 2026-02-17 | 13F | Susquehanna International Group, Llp | Call | 3 077 200 | −21,18 | 29 418 | −29,38 | |||
| 2026-02-13 | 13F | Citigroup Inc | 996 208 | −7,52 | 9 524 | −17,15 | ||||
| 2026-02-17 | 13F | Susquehanna International Group, Llp | 3 525 686 | −48,24 | 33 706 | −53,62 | ||||
| 2026-02-12 | 13F | BlackRock, Inc. | 2 454 178 | 7,44 | 23 462 | −3,74 | ||||
| 2026-02-17 | 13F | Oxford Asset Management Llp | 24 316 | 232 | ||||||
| 2026-02-17 | 13F | Parallax Volatility Advisers, L.P. | Call | 0 | −100,00 | 0 | ||||
| 2026-02-13 | 13F | Toroso Investments, LLC | 0 | −100,00 | 0 | −100,00 | ||||
| 2026-02-13 | 13F | State Street Corp | 818 741 | 5,20 | 7 823 | −5,78 | ||||
| 2026-01-23 | 13F | Wallace Advisory Group, LLC | 0 | −100,00 | 0 | |||||
| 2026-01-06 | 13F | Afg Fiduciary Services Limited Partnership | 10 000 | −14,89 | 104 | −16,13 | ||||
| 2026-01-14 | 13F | ORG Wealth Partners, LLC | 626 | 6,46 | 6 | −16,67 | ||||
| 2026-02-17 | 13F | Tower Research Capital LLC (TRC) | 71 | −95,57 | 1 | −100,00 | ||||
| 2026-02-12 | 13F | Federation des caisses Desjardins du Quebec | 370 | 0,00 | 4 | 0,00 | ||||
| 2026-02-10 | 13F | Envestnet Asset Management Inc | 285 114 | 24,54 | 2 726 | 11,59 | ||||
| 2026-02-13 | 13F | Walleye Trading LLC | Put | 678 300 | −76,91 | 6 485 | −79,32 | |||
| 2026-02-06 | 13F | HighTower Advisors, LLC | 49 495 | −8,70 | 473 | −18,17 | ||||
| 2026-02-17 | 13F | Trexquant Investment LP | 688 393 | −35,43 | 6 581 | −42,15 | ||||
| 2026-02-10 | 13F | Bank of New York Mellon Corp | 73 772 | 705 | ||||||
| 2026-01-23 | 13F | Farther Finance Advisors, LLC | Call | 0 | −100,00 | 0 | −100,00 | |||
| 2026-01-29 | 13F | Sanctuary Advisors, LLC | 14 306 | 8,82 | 137 | −2,86 | ||||
| 2025-11-12 | 13F | Commons Capital, Llc | 0 | −100,00 | 0 | |||||
| 2026-02-05 | 13F | Atria Investments Llc | 48 634 | 0,60 | 465 | −9,90 | ||||
| 2026-01-26 | 13F | Cwm, Llc | 33 299 | 0 | ||||||
| 2026-02-17 | 13F | Private Advisor Group, LLC | 257 480 | 2 462 | ||||||
| 2026-02-17 | 13F | Qube Research & Technologies Ltd | 0 | −100,00 | 0 | |||||
| 2026-01-13 | 13F | CoreCap Advisors, LLC | 1 | 0,00 | 0 | |||||
| 2026-02-17 | 13F | Quadrature Capital Ltd | 40 493 | −68,90 | 387 | −72,10 | ||||
| 2025-11-14 | 13F | Squarepoint Ops LLC | Put | 0 | −100,00 | 0 | −100,00 | |||
| 2026-02-17 | 13F | Symmetry Peak Management Llc | Call | 0 | −100,00 | 0 | ||||
| 2026-02-10 | 13F | Bnp Paribas Arbitrage, Sa | 249 200 | −3,84 | 2 382 | −13,85 | ||||
| 2025-11-13 | 13F | Healthcare Of Ontario Pension Plan Trust Fund | 0 | −100,00 | 0 | |||||
| 2026-02-13 | 13F | Wells Fargo & Company/mn | 23 864 | −83,82 | 228 | −85,51 | ||||
| 2026-02-13 | 13F | JustInvest LLC | 14 946 | 7,49 | 143 | −4,05 | ||||
| 2026-02-11 | 13F | Prudential Plc | 477 049 | 44,76 | 4 561 | 29,69 | ||||
| 2026-02-17 | 13F | Signature Equity Partners, LLC | 237 | 2 | ||||||
| 2026-03-17 | 13F/A | Barclays Plc | Put | 0 | −100,00 | 0 | ||||
| 2026-02-03 | 13F | Maxi Investments CY Ltd | 0 | −100,00 | 0 | −100,00 | ||||
| 2026-02-13 | 13F | Walleye Trading LLC | Call | 53 200 | −83,47 | 509 | −85,21 | |||
| 2026-02-13 | 13F | Walleye Trading LLC | 658 618 | −29,61 | 6 296 | −36,93 | ||||
| 2026-02-12 | 13F | Jane Street Group, Llc | Put | 2 179 200 | −64,60 | 20 833 | −68,29 | |||
| 2026-02-12 | 13F | Jane Street Group, Llc | Call | 2 612 300 | 19,46 | 24 974 | 7,03 | |||
| 2026-02-12 | 13F | Jane Street Group, Llc | 2 379 336 | −30,53 | 22 746 | −37,76 | ||||
| 2026-01-16 | 13F | Ronald Blue Trust, Inc. | 221 | −21,07 | 2 | 0,00 | ||||
| 2026-02-13 | 13F | Rhumbline Advisers | 1 323 | −8,63 | 13 | −20,00 | ||||
| 2026-02-13 | 13F | Walleye Capital LLC | 684 559 | −14,03 | 6 544 | −22,98 | ||||
| 2026-01-22 | 13F | Personal Cfo Solutions, Llc | 32 372 | 10,39 | 309 | −0,96 | ||||
| 2025-11-14 | 13F | Mangrove Partners | 0 | −100,00 | 0 | −100,00 | ||||
| 2026-02-11 | 13F | Contrarius Group Holdings Ltd | 1 071 425 | 10 243 | ||||||
| 2026-02-09 | 13F | William Blair Investment Management, Llc | 0 | −100,00 | 0 | −100,00 | ||||
| 2026-02-13 | 13F | Walleye Capital LLC | Call | 11 400 | 75,38 | 109 | 56,52 | |||
| 2026-02-13 | 13F | Squarepoint Ops LLC | 29 343 | −38,04 | 281 | −44,55 | ||||
| 2026-02-13 | 13F | Walleye Capital LLC | Put | 194 400 | 1 196,00 | 1 858 | 1 061,25 | |||
| 2026-02-17 | 13F | Royal Bank Of Canada | 5 158 | −33,12 | 49 | −40,24 | ||||
| 2026-01-27 | 13F | Bayforest Capital Ltd | 5 768 | −7,06 | 55 | −16,67 | ||||
| 2026-02-17 | 13F | Persistent Asset Partners Ltd | 0 | −100,00 | 0 | −100,00 | ||||
| 2026-02-13 | 13F | Van Eck Associates Corp | 74 181 | 0,00 | 1 | |||||
| 2025-11-07 | 13F | Alberta Investment Management Corp | 0 | −100,00 | 0 | |||||
| 2026-01-29 | 13F | IMC-Chicago, LLC | Put | 615 400 | −45,66 | 5 883 | −51,31 | |||
| 2026-01-29 | 13F | IMC-Chicago, LLC | Call | 2 450 000 | −5,28 | 23 422 | −15,13 | |||
| 2026-02-10 | 13F | Acadian Asset Management Llc | 13 377 | −95,11 | 0 | −100,00 | ||||
| 2026-01-21 | 13F | SJS Investment Consulting Inc. | 127 | 0,00 | 1 | 0,00 | ||||
| 2026-02-12 | 13F | Renaissance Technologies Llc | 775 500 | 38,14 | 7 414 | 23,76 | ||||
| 2026-02-17 | 13F | Two Sigma Advisers, Lp | 48 900 | −38,02 | 467 | −44,47 | ||||
| 2026-02-06 | 13F | Profund Advisors Llc | 59 416 | −11,32 | 568 | −20,45 | ||||
| 2026-02-18 | 13F | GWM Advisors LLC | 100 | 0,00 | 1 | −100,00 | ||||
| 2026-02-17 | 13F | Jones Financial Companies Lllp | 11 981 | −7,17 | 115 | −12,98 | ||||
| 2026-01-29 | 13F | UBS Group AG | Call | 24 000 | 0,00 | 229 | −10,55 | |||
| 2026-02-02 | 13F | Truist Financial Corp | 18 165 | −34,07 | 174 | −40,96 | ||||
| 2025-11-14 | 13F | Caption Management, LLC | Call | 0 | −100,00 | 0 | ||||
| 2026-01-29 | 13F | UBS Group AG | 380 806 | −20,76 | 3 641 | −29,00 | ||||
| 2026-01-28 | 13F | Quaker Wealth Management, LLC | 0 | −100,00 | 0 | |||||
| 2025-11-14 | 13F | Militia Capital Partners, LP | 140 000 | 1 494 | ||||||
| 2026-02-17 | 13F | Susquehanna Fundamental Investments, Llc | 0 | −100,00 | 0 | −100,00 | ||||
| 2026-02-13 | 13F | Mml Investors Services, Llc | 0 | −100,00 | 0 | |||||
| 2026-01-30 | 13F | Precision Wealth Strategies, LLC | 54 790 | −6,72 | 524 | −16,45 | ||||
| 2026-02-13 | 13F | Quinn Opportunity Partners LLC | 618 921 | 0,00 | 5 917 | −10,40 | ||||
| 2026-01-05 | 13F | GAMMA Investing LLC | 12 515 | −5,87 | 120 | −15,60 | ||||
| 2026-01-30 | 13F | Bogart Wealth, LLC | 1 868 | 0,00 | 18 | −10,53 | ||||
| 2026-02-13 | 13F | Avenir Tech Ltd | 10 346 087 | −3,01 | 98 909 | −13,10 | ||||
| 2025-10-08 | 13F/A | New York State Common Retirement Fund | 0 | −100,00 | 0 | −100,00 | ||||
| 2026-02-11 | 13F | Winton Capital Group Ltd | 37 300 | 357 | ||||||
| 2026-02-17 | 13F | D. E. Shaw & Co., Inc. | Put | 263 000 | 39,60 | 2 514 | 25,07 | |||
| 2026-02-17 | 13F | D. E. Shaw & Co., Inc. | 1 293 236 | −35,93 | 12 363 | −42,59 | ||||
| 2026-02-11 | 13F | LPL Financial LLC | 155 447 | 10,01 | 1 486 | −1,39 | ||||
| 2026-02-17 | 13F | Voloridge Investment Management, Llc | 0 | −100,00 | 0 | |||||
| 2026-02-17 | 13F | D. E. Shaw & Co., Inc. | Call | 21 800 | −95,65 | 208 | −96,11 | |||
| 2026-02-11 | 13F | Simplex Trading, Llc | 330 741 | −44,80 | 3 162 | 52 583,33 | ||||
| 2026-02-11 | 13F | Simplex Trading, Llc | Call | 951 800 | 8,41 | 9 099 | 101 000,00 | |||
| 2026-02-11 | 13F | Simplex Trading, Llc | Put | 720 800 | −28,26 | 6 891 | 68 800,00 | |||
| 2026-02-13 | 13F | Smartleaf Asset Management LLC | 176 | 2 | ||||||
| 2026-02-13 | 13F | Avenir Tech Ltd | Put | 0 | −100,00 | 0 | −100,00 | |||
| 2026-02-17 | 13F | Northern Trust Corp | 196 342 | 8,90 | 1 877 | −2,39 | ||||
| 2026-02-13 | 13F | American Century Companies Inc | 11 452 | 109 | ||||||
| 2026-02-17 | 13F | Advisory Services Network, LLC | 12 405 | −0,57 | 119 | −11,28 | ||||
| 2026-02-13 | 13F | Marshall Wace, Llp | 2 019 197 | 128,52 | 19 304 | 104,74 | ||||
| 2026-02-17 | 13F | Citadel Advisors Llc | Put | 750 200 | −59,76 | 7 172 | −63,95 | |||
| 2026-01-28 | 13F | Oversea-Chinese Banking CORP Ltd | 55 591 | −4,55 | 531 | −14,49 | ||||
| 2026-02-12 | 13F | Bank Of Montreal /can/ | 0 | −100,00 | 0 | −100,00 | ||||
| 2026-02-13 | 13F | Integrated Wealth Concepts LLC | 0 | −100,00 | 0 | |||||
| 2026-02-13 | 13F | Police & Firemen's Retirement System of New Jersey | 35 039 | −18,82 | 335 | −27,39 | ||||
| 2026-02-12 | 13F | Skopos Labs, Inc. | 10 363 | 94 | ||||||
| 2026-02-13 | 13F | National Bank Of Canada /fi/ | 430 920 | −78,20 | 4 120 | −80,47 | ||||
| 2026-02-02 | 13F | Sparta 24 Ltd. | 5 325 660 | −14,94 | 50 913 | −23,79 | ||||
| 2026-02-14 | 13F | Militia Capital Partners, LP | Call | 250 000 | 25,00 | 4 | −98,98 | |||
| 2026-02-17 | 13F | Altshuler Shaham Ltd | 1 200 | 11 | ||||||
| 2026-01-22 | 13F | Spirepoint Private Client, Llc | 30 300 | 290 | ||||||
| 2026-02-09 | 13F | Legal & General Group Plc | 12 864 | 10,95 | 123 | −0,81 | ||||
| 2026-02-10 | 13F | Jupiter Asset Management Ltd | 4 216 229 | 157,28 | 40 307 | 130,52 | ||||
| 2026-02-13 | 13F | Quarry LP | 1 708 | −85,00 | 16 | −86,78 | ||||
| 2026-02-17 | 13F | Schonfeld Strategic Advisors LLC | 0 | −100,00 | 0 | |||||
| 2025-11-13 | 13F | Eschler Asset Management LLP | 0 | −100,00 | 0 | |||||
| 2026-02-17 | 13F | Alliancebernstein L.p. | 24 238 | 0,00 | 232 | −10,47 | ||||
| 2025-11-14 | 13F | Lazard Asset Management Llc | 0 | −100,00 | 0 | |||||
| 2026-01-29 | 13F | Cornerstone Investment Partners, LLC | 20 881 | 200 | ||||||
| 2026-02-13 | 13F | Peak6 Llc | 71 311 | −84,17 | 682 | −85,83 | ||||
| 2026-02-12 | 13F | Nuveen, LLC | 77 100 | 0,00 | 737 | −10,34 | ||||
| 2026-02-13 | 13F | Peak6 Llc | Call | 110 100 | −90,53 | 1 053 | −91,52 | |||
| 2026-01-09 | 13F | SG Americas Securities, LLC | Call | 0 | −100,00 | 0 | ||||
| 2026-02-13 | 13F | Peak6 Llc | Put | 471 400 | −78,87 | 4 507 | −81,07 | |||
| 2025-11-14 | 13F | Cubist Systematic Strategies, LLC | Put | 13 400 | −29,47 | 143 | −22,40 | |||
| 2025-11-14 | 13F | Cubist Systematic Strategies, LLC | Call | 462 900 | −54,33 | 4 939 | −49,50 | |||
| 2026-02-20 | 13F | Dorsey Wright & Associates | 204 132 | 2,59 | 1 952 | −8,05 | ||||
| 2026-02-17 | 13F | Numerai GP LLC | 34 391 | 329 | ||||||
| 2026-02-13 | 13F | Morgan Stanley | 1 608 446 | −20,52 | 15 377 | −28,79 | ||||
| 2026-02-13 | 13F | Polymer Capital Management (HK) LTD | 0 | −100,00 | 0 | |||||
| 2026-02-17 | 13F | Citadel Advisors Llc | 1 186 032 | 14,04 | 11 338 | 2,18 | ||||
| 2026-02-17 | 13F | Citadel Advisors Llc | Call | 915 400 | −50,32 | 8 751 | −55,49 | |||
| 2026-02-06 | 13F | Larson Financial Group LLC | 643 | 5,93 | 6 | 0,00 | ||||
| 2026-02-09 | 13F | IPG Investment Advisors LLC | 16 150 | 154 | ||||||
| 2026-02-12 | 13F | Rossby Financial, LCC | 106 | 0,00 | 1 | 0,00 | ||||
| 2026-02-12 | 13F | Loomis Sayles & Co L P | 0 | −100,00 | 0 | −100,00 | ||||
| 2025-11-14 | 13F | Tudor Investment Corp Et Al | 0 | −100,00 | 0 | |||||
| 2026-01-27 | 13F | Asset Management One Co., Ltd. | 60 417 | 433,20 | 549 | 357,50 | ||||
| 2026-01-29 | 13F | Pictet Asset Management Holding SA | 42 100 | 0,00 | 402 | −10,47 | ||||
| 2026-02-06 | 13F | Wrapmanager Inc | 10 981 | −6,47 | 105 | −16,80 | ||||
| 2025-11-07 | 13F | Icapital Wealth Llc | 0 | −100,00 | 0 | |||||
| 2026-02-06 | 13F | Handelsbanken Fonder AB | 27 700 | 2,59 | 0 | |||||
| 2026-02-17 | 13F | Man Group plc | 1 906 970 | 6,50 | 18 231 | −4,58 | ||||
| 2026-01-29 | 13F | UMA Financial Services, Inc. | 55 | 1 | ||||||
| 2025-10-20 | 13F | Shilanski & Associates, Inc. | 31 033 | 5,03 | 331 | 16,14 | ||||
| 2026-02-13 | 13F | Pathstone Holdings, LLC | 12 562 | 0,00 | 120 | −10,45 | ||||
| 2026-02-19 | 13F | Invesco Ltd. | 99 552 | −4,75 | 952 | −14,71 | ||||
| 2025-11-13 | 13F | Canada Pension Plan Investment Board | 0 | −100,00 | 0 | |||||
| 2026-01-29 | 13F | D.a. Davidson & Co. | 0 | −100,00 | 0 | |||||
| 2026-02-17 | 13F | Cetera Investment Advisers | 50 168 | −43,84 | 480 | −49,74 | ||||
| 2026-02-13 | 13F | Ubs Asset Management Americas Inc | 38 900 | 372 | ||||||
| 2026-01-07 | 13F | Harbour Capital Advisors, LLC | 61 000 | −4,52 | 637 | −1,85 | ||||
| 2026-01-23 | 13F | Assetmark, Inc | 0 | −100,00 | 0 | |||||
| 2026-02-06 | 13F | Cullen/frost Bankers, Inc. | 2 000 | 19 | ||||||
| 2026-02-03 | 13F | SBI Securities Co., Ltd. | 5 558 | −28,16 | 53 | −35,37 | ||||
| 2026-02-13 | 13F | Caitong International Asset Management Co., Ltd | 0 | −100,00 | 0 | |||||
| 2026-02-17 | 13F | Bank Of America Corp /de/ | 1 925 882 | 978,49 | 18 411 | 866,46 | ||||
| 2026-02-17 | 13F | Jump Financial, LLC | 258 013 | −43,79 | 2 467 | −49,65 | ||||
| 2026-02-17 | 13F | Millennium Management Llc | 49 469 | −49,99 | 473 | −55,26 | ||||
| 2026-01-23 | 13F | Bingham Private Wealth, Llc | 12 659 | −0,73 | 121 | −1,63 | ||||
| 2026-02-11 | 13F | Group One Trading, L.p. | Put | 1 828 100 | −30,01 | 17 477 | −37,29 | |||
| 2026-02-11 | 13F | Group One Trading, L.p. | 4 247 722 | −0,72 | 40 608 | −11,04 | ||||
| 2026-02-17 | 13F | GeoWealth Management, LLC | 3 642 | 35 | ||||||
| 2026-02-11 | 13F | Group One Trading, L.p. | Call | 2 062 100 | −21,55 | 19 714 | −29,71 | |||
| 2026-02-10 | 13F | Goldman Sachs Group Inc | 521 123 | −66,88 | 4 982 | −70,33 | ||||
| 2026-02-17 | 13F | Lighthouse Investment Partners, LLC | 73 370 | 701 | ||||||
| 2026-02-17 | 13F | Advisor Group Holdings, Inc. | 12 197 | −79,11 | 117 | −81,73 | ||||
| 2026-01-15 | 13F | Burns Matteson Capital Management, LLC | 34 270 | 10,45 | 328 | −1,21 | ||||
| 2026-02-13 | 13F | Panagora Asset Management Inc | 630 405 | 11,20 | 6 027 | −0,38 | ||||
| 2026-02-17 | 13F | Boothbay Fund Management, Llc | 0 | −100,00 | 0 | −100,00 | ||||
| 2026-02-10 | 13F | CIBC World Markets Inc. | 22 654 | 95,29 | 217 | 75,61 | ||||
| 2026-02-10 | 13F | Exit Wealth Advisors, LLC. | 85 116 | 8,01 | 814 | −3,21 | ||||
| 2025-11-14 | 13F | Scientech Research LLC | 0 | −100,00 | 0 | |||||
| 2026-02-13 | 13F | Ieq Capital, Llc | 0 | −100,00 | 0 | |||||
| 2026-02-13 | 13F | Barclays Plc | 2 500 | −98,03 | 24 | −98,30 | ||||
| 2026-02-09 | 13F | Geode Capital Management, Llc | 204 076 | 13,37 | 1 951 | 1,56 | ||||
| 2025-11-14 | 13F | Prelude Capital Management, Llc | 0 | −100,00 | 0 | −100,00 | ||||
| 2026-01-23 | 13F | Farther Finance Advisors, LLC | 1 521 | −81,93 | 15 | −84,27 | ||||
| 2026-02-17 | 13F | Ameriprise Financial Inc | 0 | −100,00 | 0 | |||||
| 2026-02-17 | 13F | Balyasny Asset Management Llc | 17 223 | 165 | ||||||
| 2026-02-13 | 13F | Y-Intercept (Hong Kong) Ltd | 118 499 | −45,38 | 1 133 | −51,08 | ||||
| 2026-02-06 | 13F | Gsa Capital Partners Llp | 48 399 | −74,46 | 0 | −100,00 | ||||
| 2026-02-17 | 13F | Public Employees Retirement System Of Ohio | 20 900 | −44,78 | 200 | −50,62 | ||||
| 2026-02-06 | 13F | Hexagon Capital Partners LLC | 102 348 | 16,77 | 978 | 4,60 | ||||
| 2026-02-17 | 13F | Hilltop Holdings Inc. | 70 237 | 671 | ||||||
| 2026-01-26 | 13F | Mirae Asset Global Investments Co., Ltd. | 4 487 | 1,56 | 43 | −10,64 | ||||
| 2026-01-23 | 13F | Diversify Advisory Services, LLC | 59 749 | 11,60 | 544 | −7,02 | ||||
| 2026-02-13 | 13F | Delos Wealth Advisors, LLC | 488 | 5 | ||||||
| 2025-11-12 | 13F | CMT Capital Markets Trading GmbH | Put | 0 | −100,00 | 0 | ||||
| 2026-01-09 | 13F | SG Americas Securities, LLC | 545 900 | 5 | ||||||
| 2026-02-05 | 13F | Cambridge Investment Research Advisors, Inc. | 68 748 | −0,45 | 1 | |||||
| 2026-02-11 | 13F | J.w. Cole Advisors, Inc. | 13 315 | −10,52 | 127 | −19,62 | ||||
| 2026-02-13 | 13F | Stifel Financial Corp | 81 822 | 6,12 | 782 | −4,87 | ||||
| 2026-02-17 | 13F | Wiley Bros.-aintree Capital, Llc | 17 343 | −0,68 | 166 | −11,76 | ||||
| 2026-02-17 | 13F | Raymond James Financial Inc | 19 771 | −72,64 | 189 | −75,45 | ||||
| 2026-02-11 | 13F | Fox Run Management, L.l.c. | 20 555 | 197 | ||||||
| 2026-02-04 | 13F | Beverly Hills Private Wealth, LLC | 22 040 | 0,00 | 235 | 0,00 | ||||
| 2026-02-12 | 13F | Marex Group plc | 32 944 | 99,96 | 315 | 79,43 | ||||
| 2026-02-03 | 13F | Diversify Wealth Management, Llc | 174 439 | 6,29 | 1 661 | −7,26 | ||||
| 2026-02-13 | 13F | Arrowstreet Capital, Limited Partnership | 4 831 636 | −10,66 | 46 190 | −19,95 | ||||
| 2026-02-12 | 13F | CMT Capital Markets Trading GmbH | Call | 0 | −100,00 | 0 | ||||
| 2025-11-14 | 13F | Virtu Financial LLC | 0 | −100,00 | 0 | |||||
| 2026-02-12 | 13F | BRYN MAWR TRUST Co | 10 000 | −37,50 | 96 | −44,12 | ||||
| 2026-02-12 | 13F | Hollencrest Capital Management | 0 | −100,00 | 0 | |||||
| 2026-02-17 | 13F | Parallax Volatility Advisers, L.P. | Put | 4 400 | −97,01 | 42 | −97,33 | |||
| 2026-02-17 | 13F | Parallax Volatility Advisers, L.P. | 230 216 | −26,46 | 2 201 | −34,13 | ||||
| 2026-02-17 | 13F | XTX Topco Ltd | 78 916 | 615,14 | 754 | 544,44 | ||||
| 2026-02-17 | 13F | Russell Investments Group, Ltd. | 34 014 | −11,98 | 325 | −22,43 | ||||
| 2025-11-26 | 13F/A | Jpmorgan Chase & Co | Put | 0 | −100,00 | 0 | −100,00 | |||
| 2026-02-17 | 13F | Point72 Asset Management, L.P. | Call | 170 500 | 1 630 | |||||
| 2026-02-10 | 13F | REAP Financial Group, LLC | 500 | 0,00 | 5 | −20,00 | ||||
| 2026-02-17 | 13F | Point72 Asset Management, L.P. | Put | 13 100 | 125 | |||||
| 2026-02-18 | 13F | Vident Advisory, LLC | 45 113 | −7,45 | 431 | −17,12 | ||||
| 2026-02-13 | 13F | Natixis | 18 991 | −5,21 | 180 | −17,13 | ||||
| 2026-02-13 | 13F | Headlands Technologies LLC | 0 | −100,00 | 0 | −100,00 | ||||
| 2025-11-14 | 13F | Wolverine Trading, Llc | 60 322 | −54,81 | 655 | −47,89 | ||||
| 2025-11-14 | 13F | Wolverine Trading, Llc | Call | 349 100 | −0,77 | 3 791 | 14,43 | |||
| 2025-11-14 | 13F | Wolverine Trading, Llc | Put | 162 700 | −30,82 | 1 767 | −20,27 | |||
| 2026-02-11 | 13F | Capital International Investors | 5 005 706 | 47 855 | ||||||
| 2026-02-13 | 13F | Centiva Capital, LP | 0 | −100,00 | 0 | |||||
| 2026-02-17 | 13F | Nomura Holdings Inc | 15 500 | 148 | ||||||
| 2026-02-17 | 13F | PharVision Advisers, LLC | 25 260 | −63,26 | 241 | −67,12 | ||||
| 2026-02-11 | 13F | Deutsche Bank Ag\ | 6 073 | −31,78 | 58 | −38,30 | ||||
| 2026-02-06 | 13F | EverSource Wealth Advisors, LLC | 2 603 | 7,96 | 25 | −4,00 | ||||
| 2026-02-10 | 13F | Quantbot Technologies LP | 4 403 | −37,49 | 42 | −44,00 | ||||
| 2026-02-12 | 13F | Brown Brothers Harriman & Co | 0 | −100,00 | 0 | |||||
| 2026-02-17 | 13F | Two Sigma Investments, Lp | 21 751 | 208 | ||||||
| 2026-02-13 | 13F | Vontobel Holding Ltd. | 11 624 | 111 | ||||||
| 2026-02-17 | 13F | Evergreen Quality Fund GP, Ltd. | 80 700 | 771 | ||||||
| 2026-02-10 | 13F | AdvisorShares Investments LLC | 131 542 | 5,67 | 1 258 | −5,35 | ||||
| 2025-11-07 | 13F | Shell Asset Management Co | 2 164 | −68,31 | 0 | |||||
| 2026-01-23 | 13F | Stonehaven Wealth & Tax Solutions, Llc | 10 433 | 100 | ||||||
| 2026-02-02 | 13F | Cornerstone Planning Group LLC | 309 | 442,11 | 3 | 100,00 | ||||
| 2026-02-02 | 13F | Alliance Wealth Advisors, LLC /UT | 12 598 | −13,79 | 120 | −22,58 | ||||
| 2026-02-17 | 13F | Optiver Holding B.V. | 1 | 0 | ||||||
| 2026-02-11 | 13F | Jpmorgan Chase & Co | 238 374 | −79,48 | 2 279 | −81,62 | ||||
| 2026-02-11 | 13F | Harvest Fund Management Co., Ltd | 300 000 | 0,00 | 3 | −33,33 | ||||
| 2026-02-17 | 13F | Fund 1 Investments, LLC | 0 | −100,00 | 0 | |||||
| 2026-02-13 | 13F | Dymon Asia Capital (singapore) Pte. Ltd. | 0 | −100,00 | 0 | |||||
| 2026-02-06 | 13F | Abn Amro Investment Solutions | 14 992 | −19,36 | 143 | −27,78 |